Activity 1
Choose one of the graphics from Activity 1. Describe and interpret the data.
1. Number of out of school children by country (generated using the Wikidata Query Service of the number of out of school children in each country - according to data from UNESCO Institute of Statistics)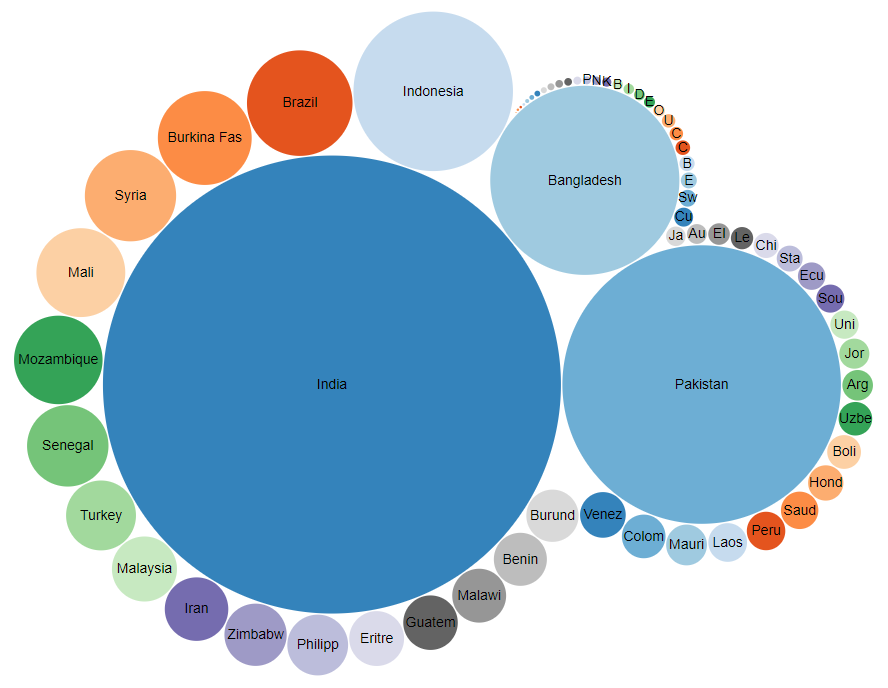
2. The results for the BPH, developed by the Swedish Kennel Club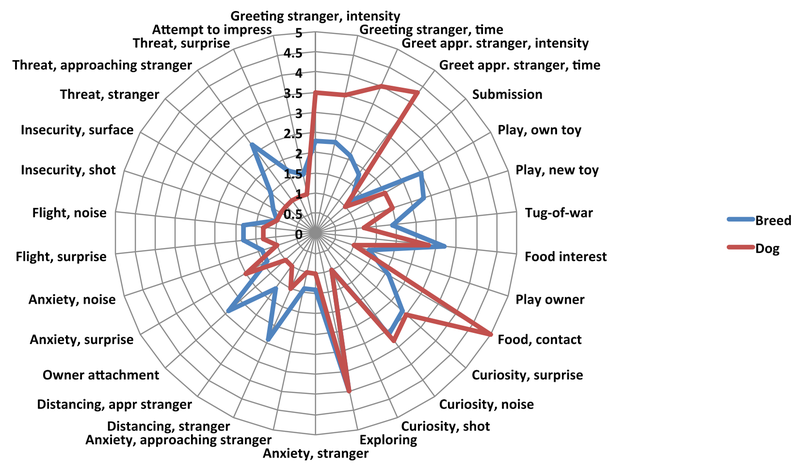
3. US electricity production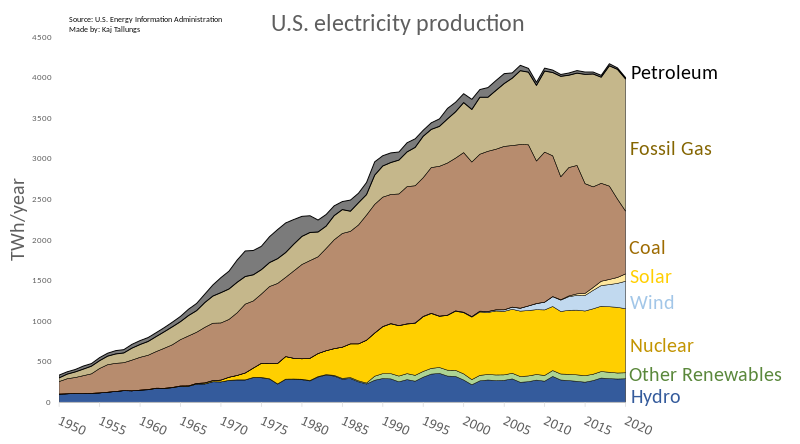
4. Purchase of the products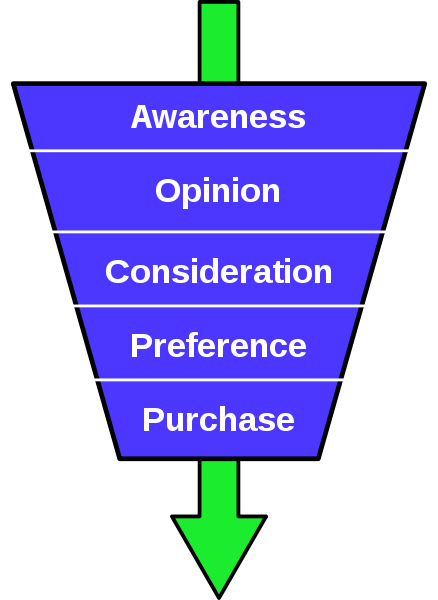
5. Difficulty of grants process
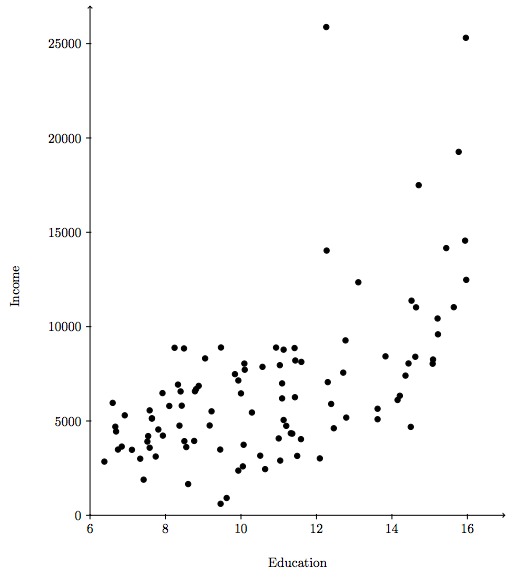
6. Education and income correlation