Delivering a Presentation
Visual aids
You may want to use visual aids throughout your speech to help the audience understand the point you are making. Visual aids come in many different forms, the main ones being: graphic (graphs and charts), three-dimensional and projected aids.
Let’s look at some examples of graphic aids. Charts and graphs are mostly used to show numerical data. When using them, be sure to double check your numbers!

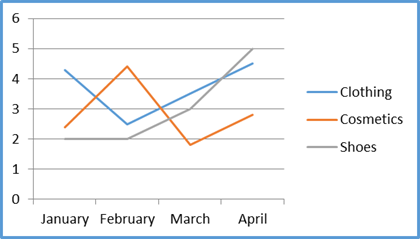
Fig. 5.1. Line graph: Sales in a major American department store

Fig. 5.2. Bar graph: Average student hours of absence per semester

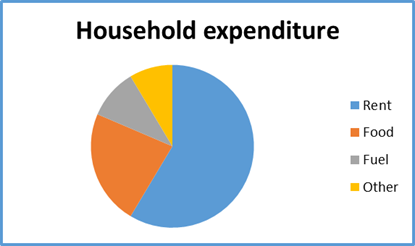
Fig. 5.3. Circle graph (pie chart): Household expenditure in Britain in 2015

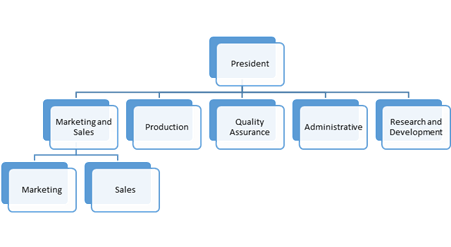
Fig. 5.4. Example of an organization chart of a company

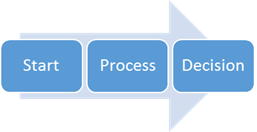
Fig.
5.5. Example of a flow chart
When you want the listeners to participate in your presentation, flip charts are the best (you can add others’ responses or ideas). You need to remember, though, that in order to use them, you need to be able to write clearly. Do not cover the whole sheet with your text; do not use too many colours, or too many words. You can draw, add human figures, and make it more interesting. You may even prepare a flip chart in advance, leaving room for additions. However, flip charts are not good for large audiences: you need everyone to see what is on the chart clearly.
Another group of aids, three-dimensional ones, can be full-scale objects or models presented to the audience. They could be almost anything, from a first-aid kit to a small-scale model of an office building.
When it comes to projected aids, the most popular nowadays seem to be computer-generated slides (e.g.: Power Point or Prezi). When using such aids, you have to remember not to flip the slides too often (allow at least 20 seconds for your audience to view each slide). Also, do not prepare too many of them for the length of your presentation.
You need to carefully choose the proper visual aids for your presentation, and decide which form they are going to take: handouts for everybody present (distributed before or after the presentation) or other visual aids used during the presentation. When it comes to handouts, usually everybody loves them and wants them. However, it is for you to decide how much information you are going to include on them. As with all facts, check lists and data. Also, think when you want to give them out. If they contain information needed during your presentation, you will distribute them in the beginning or at a particular moment in time. If they summarize your speech, you may want to wait until you end your presentation, so that they do not become an unnecessary distraction.
Visuals as such do not necessarily improve your presentation; they have to be carefully chosen to achieve the effect you want. Whatever the aids, make the text large enough, keep it simple and check for spelling errors. Remember not to talk to your visuals when presenting them: always face the audience.